DORA Metrics
DORA Metrics let you track whether your team is regularly delivering high-quality and reliable software. They are backed by years of research and real-world validation. GitDailies makes it easy to get accurate and detailed DORA Metrics for your team.
To learn about each individual DORA metric and how to interpret them, see our DORA Metrics article.
Capturing Events
To generate DORA Metrics, GitDailies needs to know when certain events occur. This section explains how to set this up.
‘Deploy’ Events
If your Deploy pipeline uses a CI/CD system (e.g. CircleCI, Octopus Deploy, Travis CI, etc.) you can notify GitDailies of Deploys by calling a GitDailies Webhook from your build pipeline.
If your Deploy pipeline uses GitHub Actions, you can let GitDailies know which Workflow is your deployment workflow.
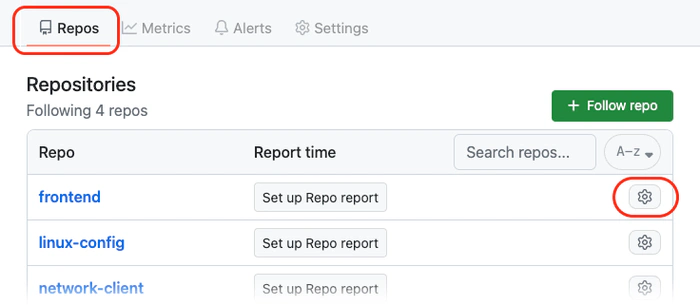
To do this, go to the Repos tab, and choose the settings icons next to the relevant Repo:
In the ‘Deployments’ section of the ‘General’ settings page, choose ‘Add deploy definition’. You can then specify which workflow deploys this repo.
Whenever this workflow successfully completes, GitDailies will record a Deploy event.
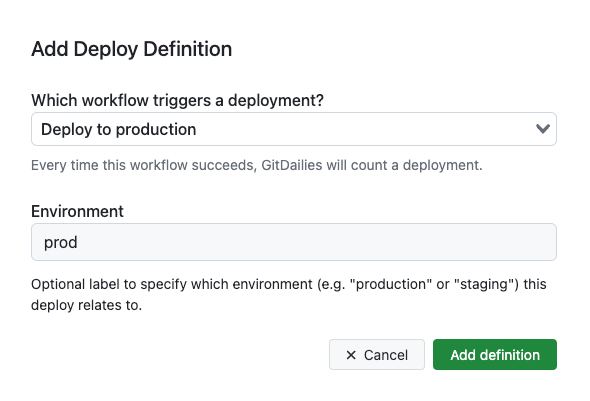
You can optionally specify which environment this deploy relates to. For example, you might want to record ‘production’ and ‘staging’ deploys separately.
‘Incident’ Events
To notify GitDailies of incidents starting or being resolved, you can call a GitDailies Webhook from your incident management system (e.g. Datadog, PagerDuty, Squadcast).
Historical Events
To get historical metrics, GitDailies needs to know about events that occurred before you set up event capture.
For GitHub Actions Deploys, GitDailies automatically finds the historical deploy events when you specify a repo’s deployment workflow.
If you notify GitDailies of deploys or incidents by calling a webhook, you can populate the historical webhook events by calling the webhook with historical data.
The DORA Metrics View
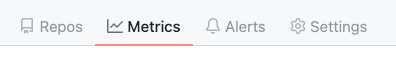
To view DORA Metrics, first choose the “Metrics” tab. This takes you to the Metrics Explorer:
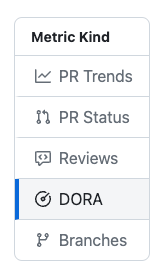
Then choose the DORA page:
Search Parameters
Choose which repos and time periods you would like to view DORA Metrics for. You can group the metrics by any combination of Repo or Time Period.
See the Metrics Explorer section for how to set search and grouping parameters.
Viewing Results
In these examples we are viewing the DORA metrics for two repos. We have chosen to “group by repo” so the results for each repo are shown separately.
These example charts show a selection of time groupings (weekly, monthly, daily).
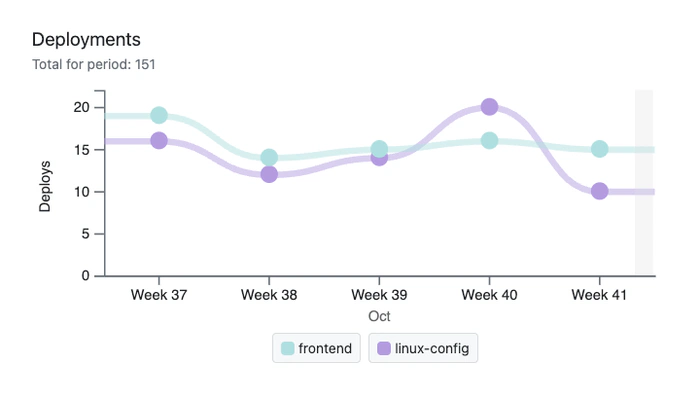
The Deployment Rate:
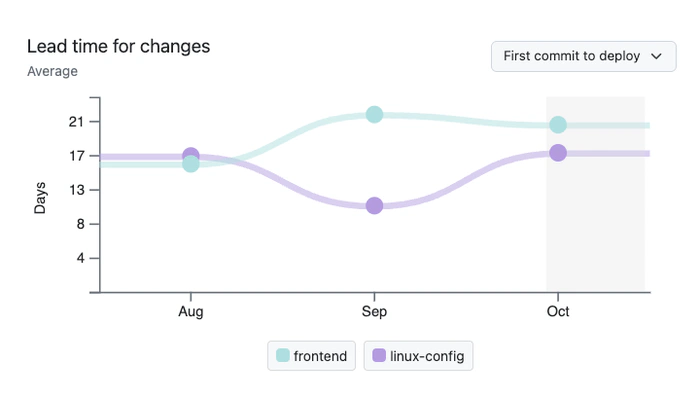
The Lead time for changes chart lets you choose how to measure change lead time:
- PR Merge until PR deploy
- First PR commit until PR deploy
Note that “First PR commit until PR deploy” handles PRs that are rebased or merged with a squash commit. GitDailies can still find the original commits and start measure lead time from that point.
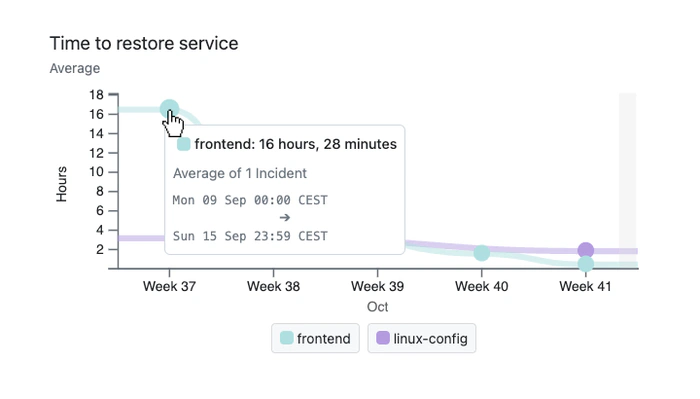
In all of the charts, you can hover over a node and see a summary of which time period it covers
and how many samples are in that time bucket. This is show in the Time to restore service chart:
Change failure rate shows what percentage of the deploys experienced one of more incidents:
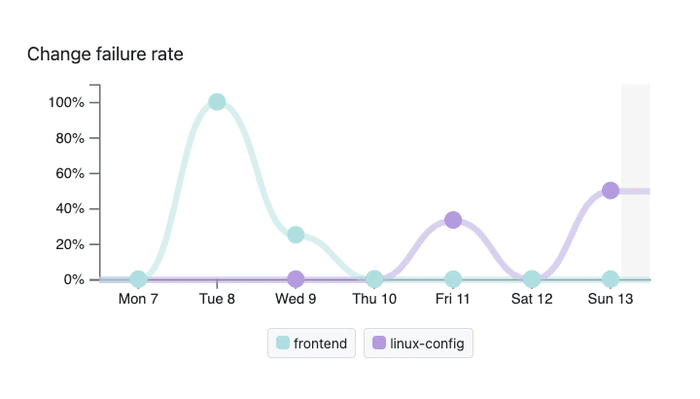
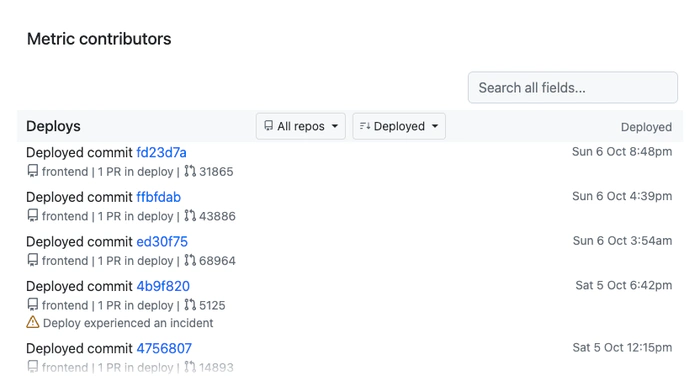
Clicking on a chart node brings up a list of all the samples that contributed to that node. Here we see the samples for a Change failure rate node. As you can see, one of the deploys in the list experienced an incident, but the majority did not:
Download CSV
You can download a CSV file of the complete data for any of the charts, or just for the Deploys or Incidents in a single time period.