Metrics for GitHub Pull Requests
The PR Trends page shows you metrics for GitHub Pull Requests over time.
Pull Request Trend Metrics
The following charts are available:
- Number of PRs opened
- Number of PRs merged
- Size of merged PRs
- Lifetime of merged PRs
- Cycle time of merged PRs
- PR Review time breakdown
For a quick introduction to these charts, check out our blog post on Pull Request metrics.
You can group the results by any combination of Repo, Team, User, Label, or Time Period.
See the Metrics Explorer section for how to set search and grouping parameters.
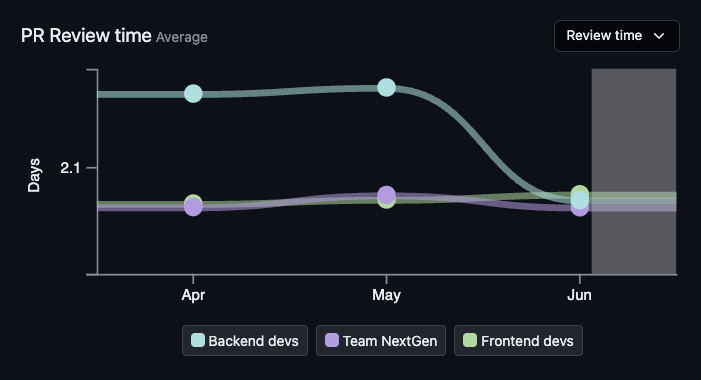
Here’s an example of “PR Merge Count” and overall PR Review Time for each team for the last three
months: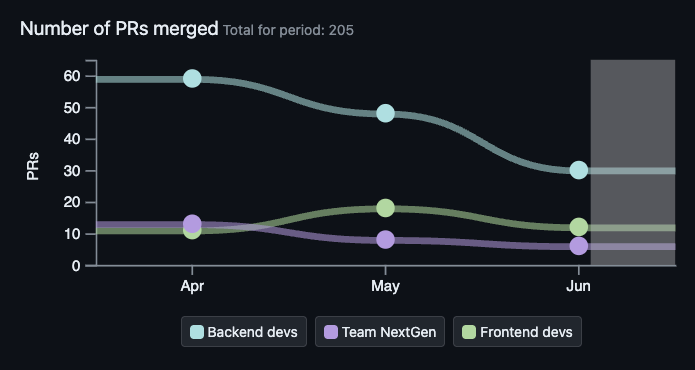
What Contributed to this Metric?
You can “drill down” into any of the nodes in a PR Trend chart by clicking on it. This opens a list of the contributing PRs:
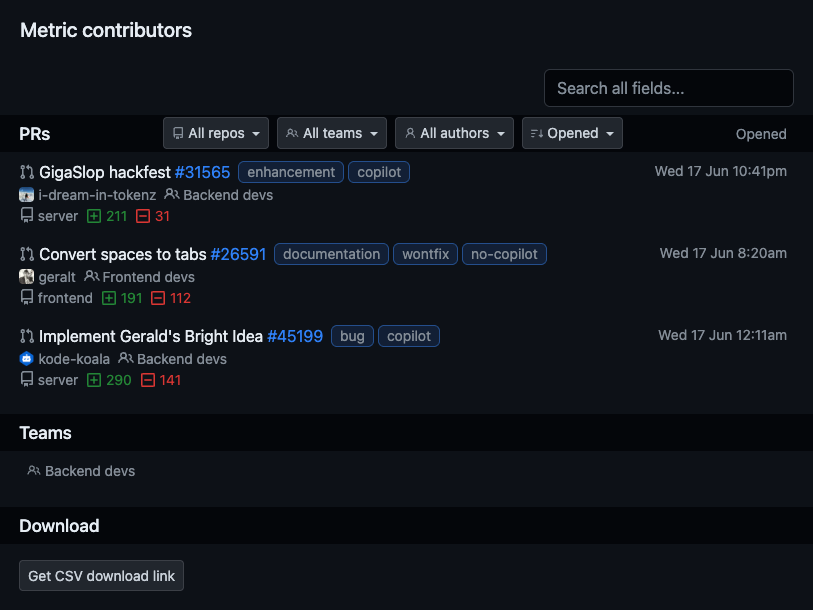
You can search, filter, and sort the contributing PRs by repo, author, team, time, etc. You can also export the results to CSV for further analysis.
Download PR Trends Metrics CSV
You can download a CSV file of the complete data for any of the charts, or just for the PRs in a single time period.