Metrics Explorer
The GitDailies Metrics Explorer makes it easy to run powerful queries and analyze your engineering stats.
Start the Metrics Explorer
To access the Metrics Explorer, sign in to GitDailies, then choose the “Metrics” tab:

The Metrics Explorer has five main views:
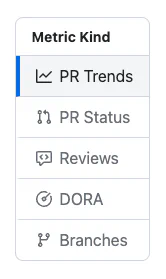
- PR Trends tracks your organization’s Pull Request metrics over time
- PR Status gives a fast overview of your organization’s open Pull Requests
- PR Reviews shows trends for submitted Pull Request reviews
- DORA Metrics provides DORA metrics for your organization
- Branches lets you visualize inactive branches across all repos
Search for Metrics
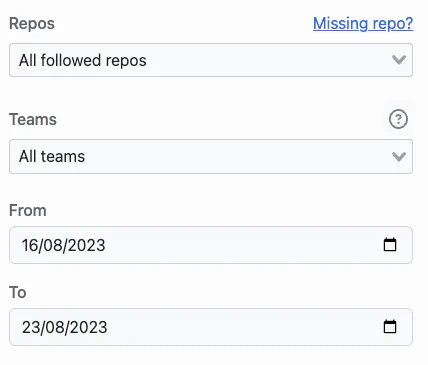
The Search section lets you choose which repositories, teams, and time periods to generate metrics for. By default all repositories and teams are searched, but you can search any combination that you choose.
For PR Trends, Reviews, and DORA metrics, you can choose which time period to search. (You don’t choose a time period for PR Status nor Branch Status metrics, because it analyzes the current status.)
Grouping Metrics
A powerful feature of GitDailies is the ability to produce metrics for various levels in your organization.
For example, you may be interested in the metrics for each team, regardless of which repository they are working in. Or you may be interested in the metrics for each repository, regardless of team.
You may want to “zoom out”, and look at metrics across the whole organization by month, or “zoom in” and look at metrics on a daily or weekly basis.
The grouping controls make it easy to do all of the above.
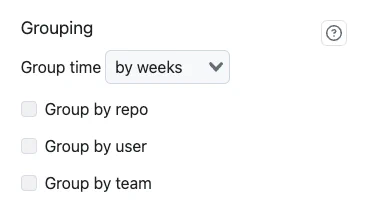
- Group by Time splits metrics into time periods. Daily metrics are useful for seeing detailed changes, while Weekly or Monthly metrics give you a higher-level view.
- Group by Repo checking this will produce an individual set of metrics for each repository. Leaving it unchecked will produce metrics for all of the repositories combined.
- Group by Team checking this will produce an individual set of metrics for each team. Leaving it unchecked will produce metrics for all of the teams combined.
Try doing some searches with different Grouping combinations. You’ll get the hang of it quickly!
Viewing Grouped Results
If you have grouped your results by repository, team, or user, you can choose which group’s metrics to view. In this example, we have chosen to group both by repository and team, so we can choose any repo and team combination from the results:

Compare Results
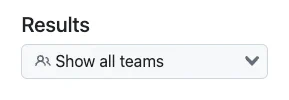
You can also overlay metrics in a chart by choosing “Show all Teams” (or repos, or users) in the results section.
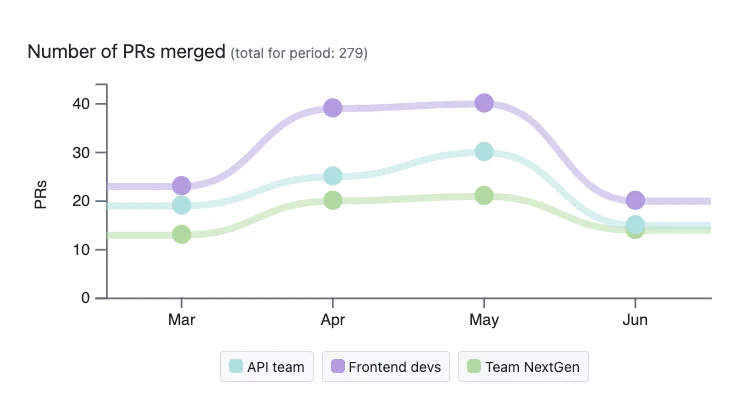
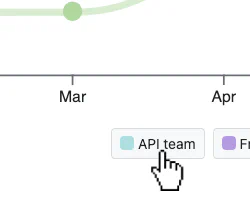
To show or hide any of the series, click on their button in the chart legend to toggle visibility.
