
DORA metrics are the four measurements developed by the DevOps Research and Assessment (DORA) team to track how well a software team delivers code: deployment frequency, lead time for changes, change failure rate, and mean time to recovery. They work for teams of any size, and they reliably point to where a delivery process can be improved.
This guide is written for engineering managers, CTOs, and developers. I’ll define each metric, share the current industry benchmarks, and show how to measure them using your GitHub data. I’ll also cover practical tips for rolling DORA out across an engineering organization.
Why track DORA metrics?
DORA metrics work because they’re empirically grounded, not just intuitive. The DORA program has surveyed more than 39,000 technology professionals over a decade of research. Teams that score well on these four metrics consistently ship more software with fewer incidents, and report less burnout, than teams that don’t.
Beyond the research, there are three practical reasons engineering teams adopt DORA metrics.
Spot delivery bottlenecks
Most engineering teams have a strong intuition that something is slow, but no shared agreement on what. DORA metrics turn that intuition into numbers. If lead time for changes is two weeks, the conversation moves from “code review feels slow” to “the median PR sits open for nine days; let’s look at what’s happening on day three”. Specific numbers are easier to act on than vague feelings.
Compare your team to industry benchmarks
The annual State of DevOps Report publishes benchmarks for each metric, broken into elite, high, medium, and low performance tiers. Knowing that elite teams deploy multiple times a day and recover from failures in under an hour gives your own numbers a frame of reference. It also gives you something to point at when discussing investment in tooling or process changes with leadership.
Catch trade-offs that single metrics miss
The four metrics are designed to balance each other. Deploying more often is only good if you’re not also breaking production more often. Faster recovery times mean little if you’re shipping ten times less code than before. Tracking all four together stops a team from gaming one number at the expense of another, which is the common failure mode of single-metric dashboards.
What are DORA metrics?
DORA metrics consist of four key indicators that measure the effectiveness of a software development team. They are:
- Deployment Frequency (DF)
- Lead Time for Changes (LTC)
- Change Failure Rate (CFR)
- Mean Time to Recovery (MTTR)
The metrics are carefully chosen to balance each other. Focusing too much on one metric can cause the others to get worse. This means you need to track and improve all four metrics to get the benefits.
The great news is that optimizing the metrics is a reliable way to improve the software delivery performance of your organization. These metrics are backed by research, and are relatively straightforward to implement.
Next, we’ll define each of the metrics and explain the benefit of tracking it.
Deployment Frequency (DF)
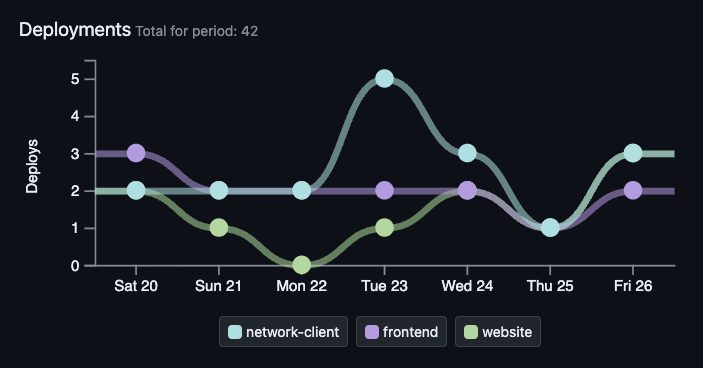
Deployment Frequency measures how often your team deploys code to production. This might range from multiple deployments each day to one deploy per month (or longer!).
Deploying more often has compounding benefits. New features and fixes reach customers sooner, and the team can respond faster to feedback or changing requirements. Smaller, more frequent deploys also reduce risk: if something breaks, the change set is small enough to find the cause quickly, and the rollback is rarely worse than re-deploying the previous version.
Formula for Deployment Frequency (DF)
The time period matters. For fast-shipping teams, “deploys per day” makes sense. For teams shipping less often, “deploys per week” or “per month” tells a clearer story.
How to measure Deployment Frequency with GitHub
You have a few options, depending on how your release process works:
- If you deploy via GitHub Actions, count the successful runs of your production deploy workflow.
- If you cut a GitHub Release for each production push, count the releases in the period.
- If you tag each production version, count tags matching your release pattern (e.g. v*).
- If your pipeline deploys on every merge to main, count merges to main.
The right source is whichever one corresponds to “code actually went live in production”. Don’t count CI runs that only built or tested, and don’t count deploys to staging.
Industry benchmark for Deployment Frequency
The 2024 DORA State of DevOps Report puts elite teams at multiple deploys per day, high performers at daily to weekly, medium at weekly to monthly, and low performers at less than once a month. Only 19% of surveyed teams hit elite. If you’re shipping at least once a week, you’re already doing better than most teams in the survey.
Lead Time for Changes (LTC)
Lead Time for Changes tracks the time from committing code until that code is successfully running in production.
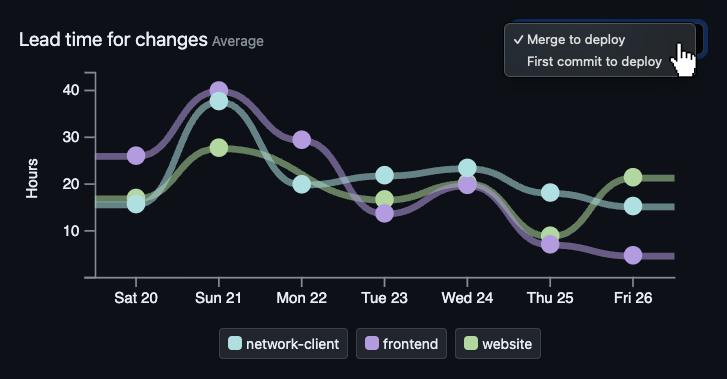
Some teams prefer to measure Lead Time for Changes as the time from a PR being merged until that PR is deployed. Ideally, your DORA tracking tools will let you see either option.
A short lead time usually means the development process itself is in good shape: small PRs, quick reviews, and a deployment pipeline the team trusts. It also makes planning more reliable, because you have a real number for how long a change takes to land rather than a guess. Teams with low LTC tend to find that work moves through review, QA, and ops with less back-and-forth, because the people involved have built habits around shipping in small increments.
Formula for Lead Time for Changes (LTC)
or
Some teams measure from code being committed. Some measure from PR merged. There’s no single right answer. Pick a definition, write it down, and stick with it. What matters more than the absolute number is whether it’s getting better or worse over time.
How to measure Lead Time for Changes with GitHub
For each production deploy, you want the commits (or PRs) that were included in it, and how long each one had been waiting. If you are measuring from the first commit time:
- Walk back through the merge commits between this deploy and the previous one.
- For each merged PR, get the timestamp of its first commit (
commits[0].commit.author.datevia the GitHub API. Don’t forget to account for squashes and rebases). - Calculate
deploy_time - first_commit_timeper PR. - Take the median across all PRs in the period.
Use the median rather than the mean. One PR that sat open for two months while someone was on holiday will wreck the mean and tell you nothing useful.
Industry benchmark for Lead Time for Changes
The 2024 report has elite at less than a day, high at one day to one week, medium at one week to one month, and low at more than a month. A reasonable internal target for most teams is “less than a working week”, which puts you in the high tier and is achievable without rebuilding your whole pipeline.
Change Failure Rate (CFR)
Change Failure Rate measures the percentage of deployments that cause a failure in the production environment.
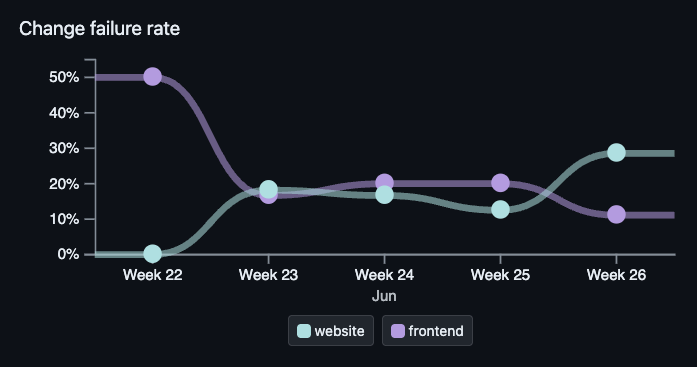
Fewer failures in production is obviously a good thing. It’s also important to have accurate failure numbers so you can see changes over time.
A low CFR is a sign that your tests, review process, and pre-production environments are doing their job. Users see a more stable product, and the team spends less time on hotfixes and firefighting, which frees up capacity for actual feature work. CFR is also a good early warning signal: if it starts trending upward, that’s usually the first visible symptom of a deeper problem in the pipeline, like flaky tests or skipped review.
Formula for Change Failure Rate (CFR)
A “failed” deployment is one that caused a production incident, needed a hotfix, or got rolled back. Plain CI failures don’t count because they never reached production in the first place.
How to measure Change Failure Rate with GitHub
This is the metric people argue about most, because “failed” depends entirely on your definition. A few practical approaches:
- Count revert PRs to main and treat each one as a failure of the original change.
- Count hotfix PRs, identified by branch name (hotfix/*), a label, or a commit-message convention.
- If you tag rolled-back releases, count those.
- Pull from your incident tool (PagerDuty, Incident.io) and link each incident back to the deploy that caused it. This is the most accurate approach if you have an incident tool already in place.
The simplest setup is a label or branch-naming convention for hotfixes and reverts, applied consistently. Once that’s in place, the metric is just a count.
Industry benchmark for Change Failure Rate
The 2024 report shows elite teams at roughly 5%, with high and medium teams clustering between 10 and 20%. One thing worth flagging: the same report noted that high performers had a higher change failure rate than medium performers in 2024, which is the opposite of what you’d expect. The DORA team has acknowledged this metric as the noisiest of the four. Treat the number as a directional signal, not a precise score.
Mean Time to Recovery (MTTR)
Mean Time to Recovery is the average time it takes to recover from a failure in the production environment.
DORA has officially renamed this to Failed Deployment Recovery Time (FDRT) to focus specifically on recoveries from failed deploys rather than all production incidents. Most people still call it MTTR, so we’ll do the same here.
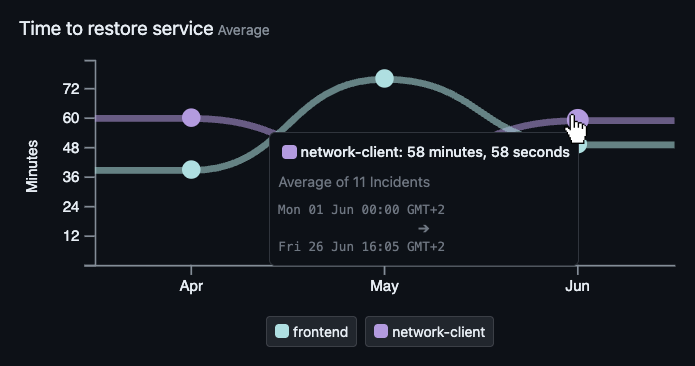
You want MTTR to be as low as possible. A short MTTR means production issues are detected quickly, the team has the tooling and procedures to diagnose them, and the rollback or fix path is well-rehearsed. The customer impact of any single failure is bounded by how long it takes to recover, so a team with a healthy MTTR can ship faster without trading off reliability.
Formula for Mean Time to Recovery (MTTR)
Across all failed deployments in the period. The clock starts at detection, not at the original deploy, because you can’t recover from a failure you don’t know about yet.
How to measure Mean Time to Recovery with GitHub
For a GitHub-native setup:
- Detection time: the timestamp on the issue, alert, or revert PR being opened.
- Recovery time: the merge timestamp of the fix or revert PR.
- Subtract one from the other for each incident, then take the average.
If you use a dedicated incident tool, that’s a better source of truth than GitHub. Pull recovery times from there and link each incident back to the deploy that triggered it.
Industry benchmark for Mean Time to Recovery
The 2024 report puts elite teams at under an hour, with both high and medium teams typically recovering inside a day. Low performers can take a week or longer. For most teams, the single biggest lever on this number is having a fast, trusted rollback. If a one-button revert exists and the team trusts it enough to use it without a meeting, MTTR drops dramatically.
Implementing DORA metrics in your organization
Check out our guide on implementing DORA metrics.
Frequently asked questions
What does DORA stand for?
DORA stands for DevOps Research and Assessment. It’s a research program founded by Nicole Forsgren, Jez Humble, and Gene Kim in 2014. The program was acquired by Google in 2018 and publishes the annual State of DevOps Report.
What are the four DORA metrics?
The four DORA metrics are deployment frequency (how often you deploy to production), lead time for changes (how long code takes to go from commit to production), change failure rate (the percentage of deploys that cause incidents), and mean time to recovery (how quickly you recover from a failure). They were defined by the DevOps Research and Assessment program and are the industry standard for measuring software delivery performance.
What is the fifth DORA metric?
The fifth DORA metric is Deployment Rework Rate. It’s defined as the ratio of deployments that are unplanned but happen as a result of an incident in production.
It captures the “we need to patch this now” work that happens after an incident, separate from planned feature or maintenance releases. A high rate is usually a sign that changes are reaching production with hidden defects, weak safeguards, or gaps in review, testing, observability, or rollout practices.
Older DORA and State of DevOps material called Reliability the fifth metric, but DORA now treats reliability as an operational performance measure rather than one of the delivery metrics.
Are DORA metrics still relevant in 2026?
Yes. The metrics themselves haven’t changed and still correlate with high-performing teams. The 2025 State of DevOps Report did replace the four-tier classification (elite, high, medium, low) with seven team archetypes, but the underlying measurements stayed the same. Most organizations using DORA still work with the four-metric model.
What is a good deployment frequency?
According to the 2024 DORA State of DevOps Report, elite teams deploy multiple times per day, high performers deploy daily to weekly, medium performers deploy weekly to monthly, and low performers deploy less than once a month. For most teams, hitting at least once a week is a reasonable first target.
What is the difference between MTTR and Failed Deployment Recovery Time?
DORA renamed Mean Time to Recovery (MTTR) to Failed Deployment Recovery Time (FDRT) to clarify that the metric only counts failures caused by deployments, not all production incidents. The calculation is the same. Most engineers still call it MTTR in casual use.
Can you track DORA metrics from GitHub data alone?
Yes, mostly. GitHub provides what you need for deployment frequency (releases, tags, or Actions runs) and lead time for changes (commit and merge timestamps). Change failure rate and recovery time work better if you also tag hotfix or revert pull requests consistently, or link incidents from a tool like PagerDuty back to the deploy that caused them.
Are DORA metrics useful for small teams?
Yes. The metrics are straightforward enough for a single-team setup, and small teams often find it easier to act on the data because there’s less organizational distance between the people measuring and the people deploying. The benchmarks come from teams of all sizes, so a five-person team can compare against the same tiers as a 500-person engineering organisation.
Want to learn more?

The book Accelerate: The Science of Lean Software and DevOps: Building and Scaling High Performing Technology Organizations by Nicole Forsgren, Jez Humble and Gene Kim is highly recommended. It contains many real-world examples of the methods and benefits of tracking DORA metrics.
What’s more, the authors co-founded the DevOps Research and Assessment organization which developed the DORA metrics, so they write on the subject with great authority and experience.
Conclusion
DORA metrics are useful because they’re concrete, balanced, and grounded in research. Pick a definition for each, measure consistently, and track the trend over a few months before drawing conclusions. The numbers themselves matter less than the conversations they enable.
If you use GitHub, you have most of what you need to start measuring today. Try it manually for a sprint or two to see what shape the data takes for your team. If you’d rather skip the manual setup, GitDailies generates all four metrics from your GitHub data automatically.
Wondering what you can do next?
Finished this article? Here are a few more things you can do:
- Get a demo of GitDailies and see your team's metrics live.
- Start measuring your team with GitDailies — free for 2 repos.
- Share this article on social media