Project Dashboard
A Project’s Dashboard contains a summary of the latest Project report, and a snapshot of Pull Request metrics.
Latest Report Summary
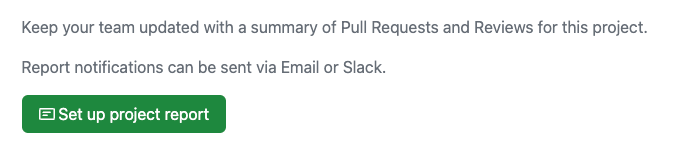
If you have set up a Project Report, the latest summary will be shown.
If you haven’t set up a Project Report, you will be given the option to do so.
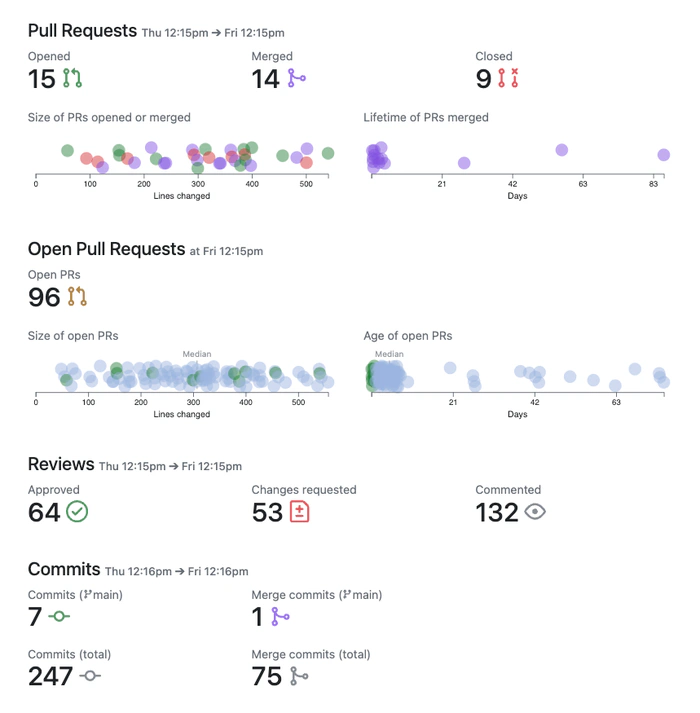
PR Metrics Snapshot
The Dashboard page has a snapshot of the Project’s Pull Request metrics for the last week.
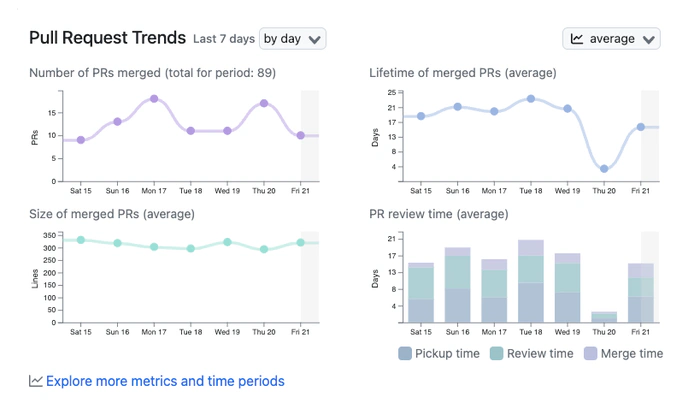
You can alter the timescale to show the weekly or daily total.
To explore more metrics, and longer time periods, follow the link at the bottom. This will take you to the Metrics Explorer, with the Project’s Repos and Teams selected.