
In 2005, YouTube uploaded its first video: 19 seconds of a man standing in front of elephants. The same year, another project arrived with considerably less potential for cat videos.
Git was created after the Linux kernel community lost free access to BitKeeper, the distributed version control system it had been using. Linus Torvalds and other kernel developers needed an alternative that was fast, distributed, capable of supporting non-linear development, and efficient enough for the Linux kernel.
What began as a solution to a specific version-control problem became an industry standard. Git is now so dominant that “Git repository” is sometimes treated as shorthand for source control itself. There are still exceptions, of course. Somewhere, someone is opening TortoiseSVN on a Windows work laptop.
Git also created something its original designers were not primarily trying to build: a detailed history of how software changes. Commits, branches, pull requests, reviews, merges, CI runs, and deployments can reveal where work slows down and how reliably changes reach users. The challenge is turning that history into useful signals without turning measurement into surveillance.
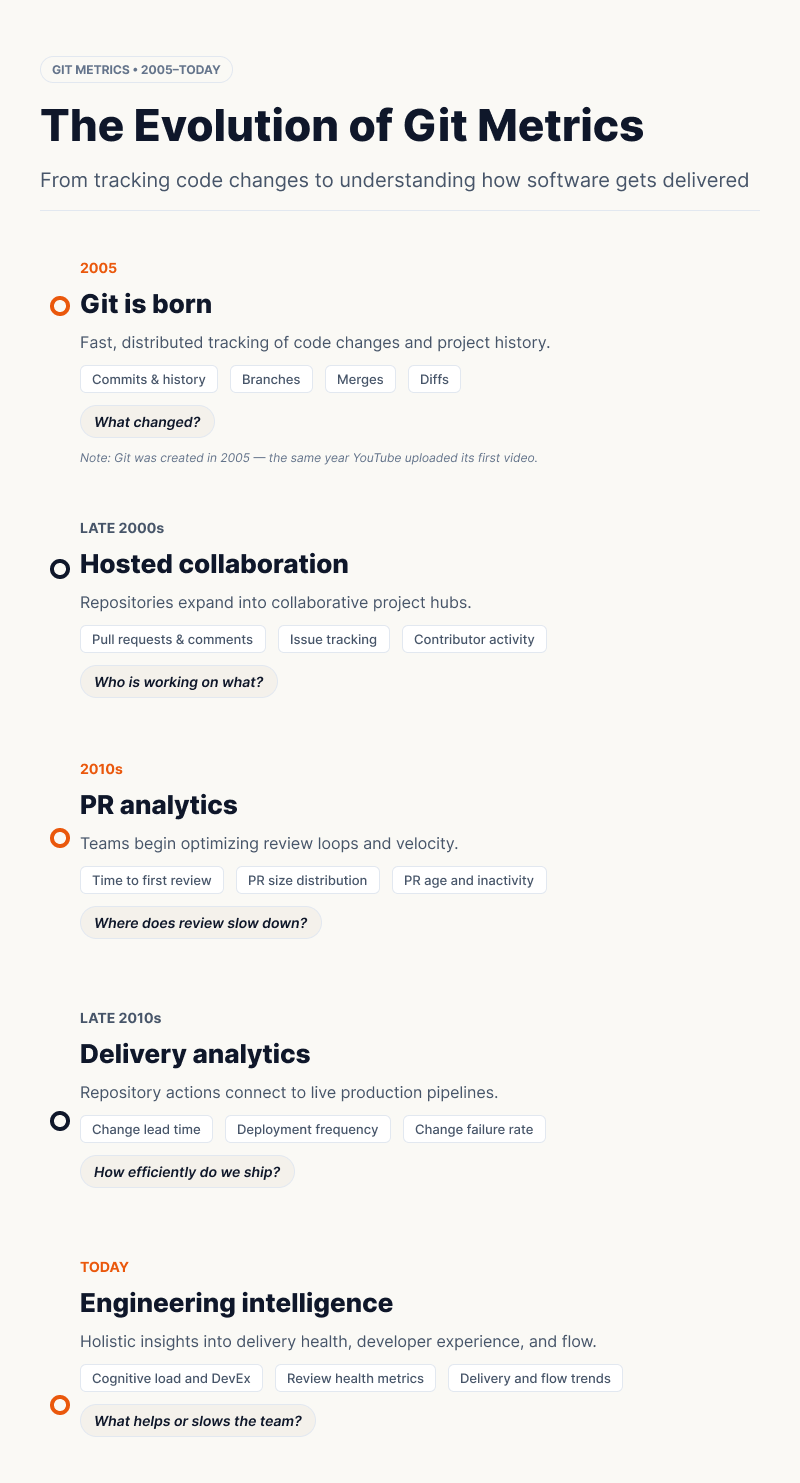
Git started by answering a simple question: what changed?
Early Git information was mostly about the code itself. A commit points to a snapshot of the project and records metadata such as its author, committer, parent commit or commits, and message. Branches allow development to diverge, diffs compare versions, and merges bring separate lines of work together.
Git could answer practical questions: What changed? Who authored it? When was it committed? How does this version differ from another? Those questions still matter, but modern engineering analytics adds workflow and delivery context.
Hosted platforms made Git collaborative
Git is distributed by design, but hosted platforms turned repositories into shared project hubs. GitHub appeared in 2008, and its pull-request workflow gave developers a visible place to propose, discuss, and review changes.
The repository became a record of collaboration as well as code. Teams could see which pull requests were open, which changes were waiting for review, who participated, how large the changes were, and which issues were connected to them.
Counting activity was an obvious next step—and an easy place to go wrong. A developer who creates 20 commits is not automatically twice as productive as someone who creates 10. The same applies to lines of code, pull-request counts, and review comments. Activity shows that something happened; it rarely shows whether software delivery improved.
Pull requests made waiting visible
Pull requests added another useful ingredient to repository data: elapsed time. Teams could begin measuring where work waited.
Time to first review shows how quickly someone responds after a PR becomes ready. PR age highlights changes that remain open. Review time shows how long work spends in review, although exact definitions vary among tools. PR size can flag changes that may demand more reviewer attention.
These metrics describe the system around developers instead of merely counting how busy they appear. Suppose a team’s pull requests usually receive a first review within four hours, but the median rises to 14 hours over several weeks. The team can investigate the review process instead of blaming an individual. Ownership may be unclear, one experienced developer may have become the default reviewer, or PRs may have grown larger.
The metric identifies where to look. The team supplies the explanation.
Repository metrics expanded into delivery metrics
Engineering analytics eventually moved beyond what happened before a merge. Teams also wanted to know how quickly a merged change reached users and what happened after deployment.
Current DORA guidance uses five software-delivery metrics:
- Change lead time
- Deployment frequency
- Failed deployment recovery time
- Change failure rate
- Deployment rework rate
Git supplies part of this story, especially commit and change history. Reliable DORA measurement may also require CI/CD, deployment, and incident data. Repository activity alone cannot prove that a change reached production or show how the service behaved afterward.
The questions evolved with the tooling. Git answered what changed. Pull-request analytics exposed where review slowed down. Delivery analytics examines how efficiently and safely changes reach production.
The next step is engineering intelligence
Repository and delivery data can describe a workflow, but they cannot explain every problem within it. A team may have a short cycle time while developers deal with constant interruptions. PR throughput may increase after the adoption of AI coding tools while review effort rises. A dashboard may look healthy even when the development environment is frustrating to use.
The SPACE framework reflects this limitation. It treats developer productivity as multidimensional: satisfaction and well-being, performance, activity, communication and collaboration, and efficiency and flow. No single activity measure can represent all five dimensions.
Modern engineering analytics therefore combines signals such as repository activity, review health, delivery performance, reliability, developer experience, and team feedback. The aim is not to collect everything. It is to collect enough evidence to identify friction and decide what to change.
A repository is a data source, not a performance review
Repositories contain enough individual activity data to make poor measurement decisions easy. It is simple to count commits, rank developers by merged PRs, compare review comments, or measure push frequency. That does not make those comparisons useful.
Once an activity metric becomes an individual target, people have an incentive to optimize the number. Commit targets encourage unnecessary commit splitting. Lines-of-code targets can reward complexity. PR counts can penalize developers working on difficult changes that take longer.
Use repository data to investigate the delivery system, not to create a productivity leaderboard. A useful test is to ask what the team would do if a metric changed. If nobody can name a decision or action, the metric probably does not deserve a prominent place on the dashboard.
Turning repository events into useful signals
The difficult part is not collecting more events. It is converting them into information that a team can understand and act on.
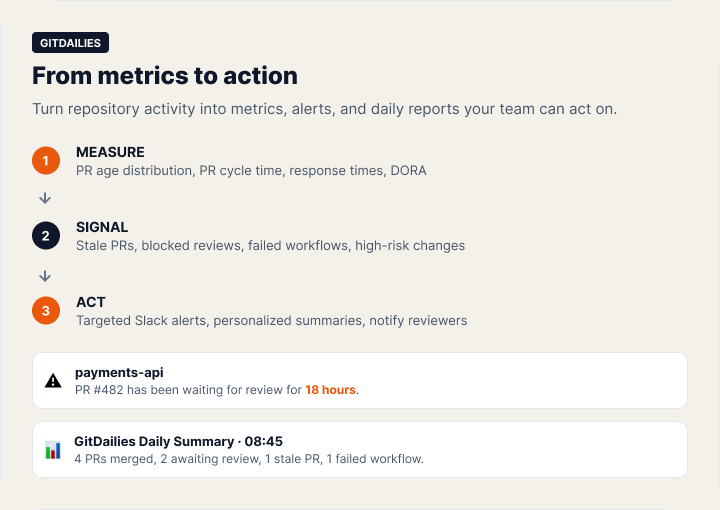
GitDailies is one example of that transition. Its Metrics Explorer covers PR trends and status, review trends and status, and DORA metrics. Results can be filtered by repositories, teams, users, labels, PR size, bot authorship, base branch, and time period, then grouped to compare repositories, teams, or periods. Teams can also inspect the pull requests behind a result instead of treating an aggregate as the whole explanation.
The same data can support immediate action. Configurable alerts can flag stale or inactive PRs, waiting review requests, failed GitHub Actions workflows, and changes to critical files. Notifications can go to the relevant Slack channel or direct message, as well as email or Telegram, instead of broadcasting every repository event to everyone.
Scheduled activity reports provide a lighter alternative to constantly checking a dashboard. A report can combine activity from several repositories, filter activity to specific teams, and arrive shortly before a morning sync. The team then starts with a shared view of recent commits, pull requests, reviews, open work, and selected metrics.
That is where Git metrics become useful: not when a dashboard accumulates another chart, but when a signal reaches the people who can remove the bottleneck.
Good Git analytics should create fewer surprises
More than twenty years after Git appeared, repositories contain far more than a history of source-code changes. They show how work moves through review, where it waits, and—when connected with delivery systems—how changes reach production.
Not every available data point deserves to become a metric. Useful analytics helps a team investigate why reviews are waiting, why PRs are growing, why cycle times differ between repositories, or why deployments require repeated fixes.
The value lies in the response. If the data leads to clearer review ownership, smaller changes, better testing, or fewer delivery bottlenecks, the metric has done its job. If it only adds a score beside someone’s name, it has not.
Git began as a way to manage changes to code. The history it records can now help teams improve how they build and deliver software.
Wondering what you can do next?
Finished this article? Here are a few more things you can do:
- Get a demo of GitDailies and see your team's metrics live.
- Start measuring your team with GitDailies — free for 2 repos.
- Share this article on social media